Today, we’ll be covering admissions trends but with the effect of race/ethnicity considered. It’s widely known that many college, universities, and professional schools employ affirmative action as part of their admissions process.
As a consequence, there are many questions about what affirmative action entails and what kind of boost certain applicants might receive relative to those of other racial or ethnic classifications.
As such, by venturing into data from the Association of American Medical Colleges, we can obtain an understanding of the isolated effect of race on the admissions process by holding certain variables constant, notably GPA and MCAT scores.
We can also use this data to derive various regression models to devise an algorithm to create a medical school admissions calculator, at least with respect to AMCAS school data.
We can control for varying level of selectivity, by introducing a “selectivity factor” into the fray to account for an applicant’s risk tolerance. The link to the calculator accounting for race/ethnicity in the admissions process can be found at the bottom of this article.
Table of Contents
General Methodology
The results of this study – and the creation of the admissions chancing calculator – were formulated off multiple linear regression analysis.
Quantile regression was performed to test for normality in the data and ensure linear methods would be suitable to mathematically model the data.
To ensure the integrity of the model, confidence intervals were obtained via method of moments estimations as well as non-parametric bootstrapping (based on 1,000 resampling replicates in the case of the latter) for all GPA and MCAT as categorized by race/ethnicity (or the overall applicant pool).
Data were taken from all 2012-14 AMCAS admissions results based on acceptance rates pertaining to the number of individuals who obtained at least one offer of admission.
Given that data is organized by bins and not by individual applicant, data below a GPA threshold of 2.60 was dismissed from the study due to small sample size. The regression model will, however, extrapolate chances outside of this range.
Results
In this section are the findings of the effect of race on medical school admissions rate.
The admissions chancing calculator was designed as a tool for those to not only assess their own admissions chances, but to see side-by-side comparisons of the effect of race/ethnicity in the admissions process for those interested from an academic perspective as GPA and MCAT inputs are manipulated.
You can observe side-by-side comparisons of chancing and other admissions-related information based on categorical headings of All (candidates), Whites, Asians, and URM (underrepresented minorities).
We will deduce our conclusions in terms of how much URM status is of significance when holding other variables constant. These will be reported in terms of how many MCAT and GPA points URM status is worth in terms of:
- The entire applicant pool (i.e., the advantage a URM would have relative to all applicants together, including URM’s)
- Relative to whites only (i.e., the advantage a URM would have relative to those who list their race/ethnicity as “white/Caucasian”)
- Relative to Asians only (i.e., the advantage a URM would have relative to those who list their ethnicity as “Asian”)
One thing to note is how the points equivalency decreases as one ventures down the various designated GPA/MCAT categories.
That is, for high MCAT scores, the GPA point equivalency that URM status provides is higher than for lower MCAT scores. Additionally, for high GPA’s, the MCAT point equivalency is higher than for lower GPA’s.
It is too simplistic to say that URM status conveys X number of GPA points or Y number of MCAT points unless it’s compared to the corresponding GPA/MCAT score.
Also, point equivalencies can differ based on the reference point.
For example, if we are controlling for MCAT (say 26, roughly an average score), then the GPA equivalency might be different based on what our reference GPA happens to be. If our reference is 3.50, then it might be different if we have 4.00 as our reference point.
This is due to the nature of GPA and MCAT sensitivity curves as they pertain to admissions results.
However, as admissions chances become more difficult in the case of lower MCAT scores, venturing upward in our GPA reference point is a necessity.
For the lowest MCAT category considered (MCAT scores of less than 7), we naturally had to venture up to 4.00 as our reference point.
Admissions chances are essentially zero when working from a lower GPA. They are very near-zero for all applicants regardless.
Relative to the entire applicant pool
If GPA is held constant:
Very High (40+) MCAT Scores: Minority status is worth approximately 0.73 GPA points
High (34-40) MCAT Scores: Minority status is worth approximately 0.64 GPA points
Moderately High (29-35) MCAT Scores: Minority status is worth approximately 0.55 GPA points
Average (22-28) MCAT Scores: Minority status is worth approximately 0.44 GPA points
Moderately Low (15-21) MCAT Scores: Minority status is worth approximately 0.30 GPA points
Low (8-14) MCAT Scores: Minority status worth approximately 0.20 GPA points
Very Low (<7) MCAT Scores: Minority status is worth approximately 0.12 GPA points
If MCAT score is held constant:
Very High (3.80-4.00) GPA: Minority status is worth approximately 6-7 MCAT points
High (3.60-3.79) GPA: Minority status is worth approximately 6-7 MCAT points
Moderately High (3.40-3.59) GPA: Minority status is worth approximately 6 MCAT points
Average (3.20-3.39) GPA: Minority status is worth approximately 5-6 MCAT points
Moderately Low (3.00-3.19) GPA: Minority status is worth approximately 5-6 MCAT points
Low (2.80-2.99) GPA: Minority status worth approximately 5-6 MCAT points
Very Low (<2.80) GPA: Minority status is worth approximately 4-5 MCAT points
Relative to the white applicant pool
If GPA is held constant:
Very High (40+) MCAT Scores: Minority status is worth approximately 0.79 GPA points
High (34-40) MCAT Scores: Minority status is worth approximately 0.68 GPA points
Moderately High (29-35) MCAT Scores: Minority status is worth approximately 0.60 GPA points
Average (22-28) MCAT Scores: Minority status is worth approximately 0.48 GPA points
Moderately Low (15-21) MCAT Scores: Minority status is worth approximately 0.37 GPA points
Low (8-14) MCAT Scores: Minority status worth approximately 0.25 GPA points
Very Low (<7) MCAT Scores: Minority status is worth approximately 0.19 GPA points
If MCAT score is held constant:
Very High (3.80-4.00) GPA: Minority status is worth approximately 7 MCAT points
High (3.60-3.79) GPA: Minority status is worth approximately 7 MCAT points
Moderately High (3.40-3.59) GPA: Minority status is worth approximately 6-7 MCAT points
Average (3.20-3.39) GPA: Minority status is worth approximately 6-7 MCAT points
Moderately Low (3.00-3.19) GPA: Minority status is worth approximately 6-7 MCAT points
Low (2.80-2.99) GPA: Minority status worth approximately 6-7 MCAT points
Very Low (<2.80) GPA: Minority status is worth approximately 6 MCAT points
Relative to the Asian applicant pool
If GPA is held constant:
Very High (40+) MCAT Scores: Minority status is worth approximately 0.90 GPA points
High (34-40) MCAT Scores: Minority status is worth approximately 0.82 GPA points
Moderately High (29-35) MCAT Scores: Minority status is worth approximately 0.72 GPA points
Average (22-28) MCAT Scores: Minority status is worth approximately 0.59 GPA points
Moderately Low (15-21) MCAT Scores: Minority status is worth approximately 0.45 GPA points
Low (8-14) MCAT Scores: Minority status worth approximately 0.33 GPA points
Very Low (<7) MCAT Scores: Minority status is worth approximately 0.21 GPA points
If MCAT score is held constant:
Very High (3.80-4.00) GPA: Minority status is worth approximately 9 MCAT points
High (3.60-3.79) GPA: Minority status is worth approximately 8-9 MCAT points
Moderately High (3.40-3.59) GPA: Minority status is worth approximately 8-9 MCAT points
Average (3.20-3.39) GPA: Minority status is worth approximately 8 MCAT points
Moderately Low (3.00-3.19) GPA: Minority status is worth approximately 7-8 MCAT points
Low (2.80-2.99) GPA: Minority status worth approximately 7-8 MCAT points
Very Low (<2.80) GPA: Minority status is worth approximately 7-8 MCAT points
GPA and MCAT Sensitivity Curves As They Pertain To Chances of Receiving at Least One Medical School Acceptance
Entire Applicant Pool
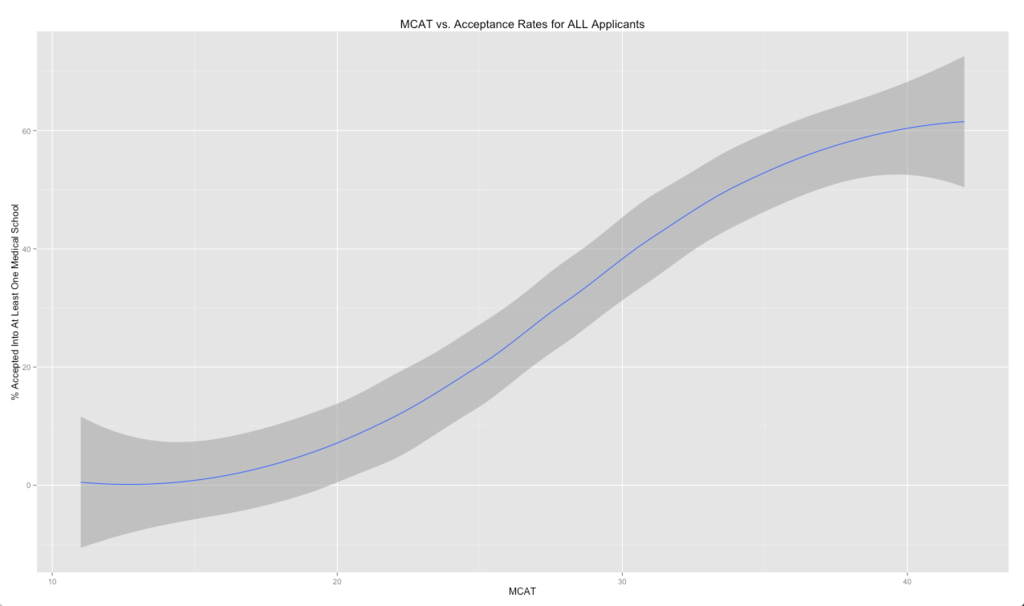
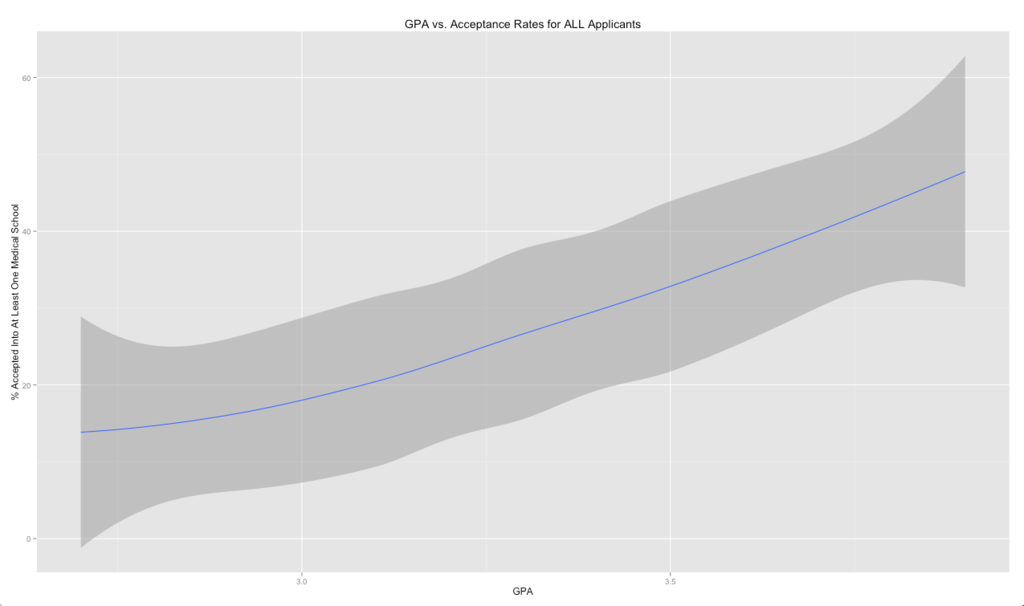
There is no flattened sensitivity in the overall curve. An exponential increase denotes a steepening positive effect on admissions probability. Linear growth denotes approximately a one-to-one positive effect on admission chances.
Diminishing growth shows a less than one-to-one growth in admissions odds. Increasing one’s score helps move oneself up the probability curve, but not to the same extent as raising it from lower scoring tiers before.
With respect to GPA, there is exponential growth up to around 3.15, and linear growth above 3.15. There is no diminishing growth or flat sensitivity observed.
White Applicant Pool
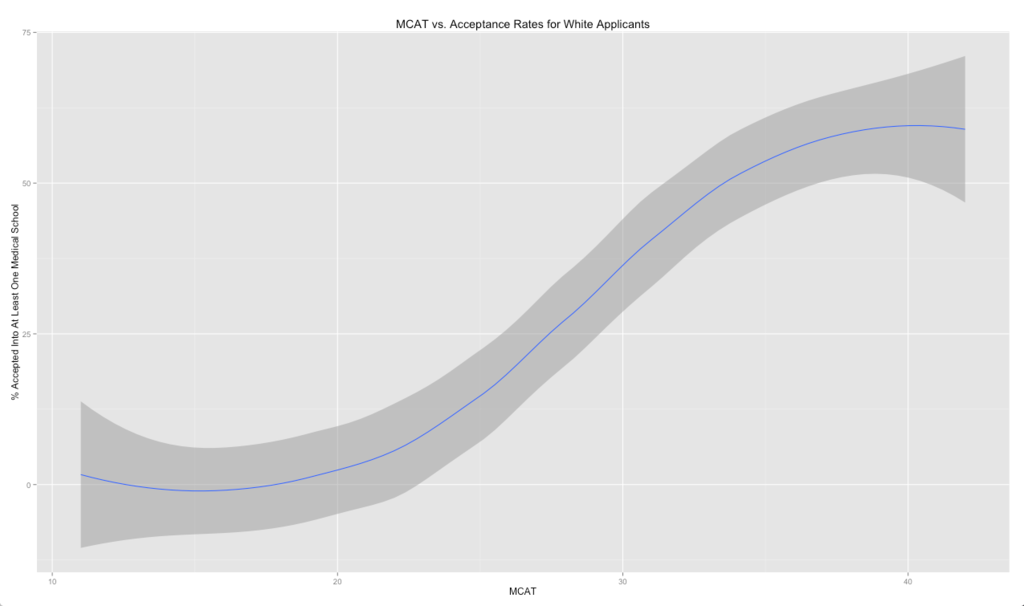
There is even some negative growth observed beyond 42, but is purely due to the small sample size of those achieving scores beyond 42.
This is noted by the standard error cloud (accompanying the line) on the tail ends of each distribution. Higher standard error denotes less certainty at the upper and tail ends.
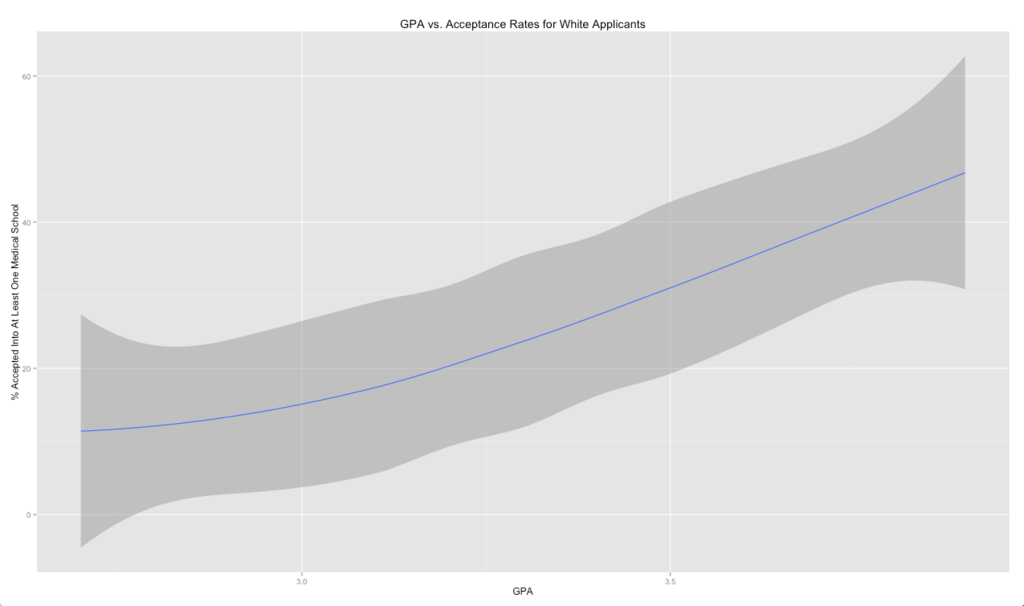
In terms of GPA, there is exponential growth from the 2’s up through approximately 3.2; from 3.2 onward there is near-exact linear growth. No diminishing returns or flattening is observed.
Asian Applicant Pool
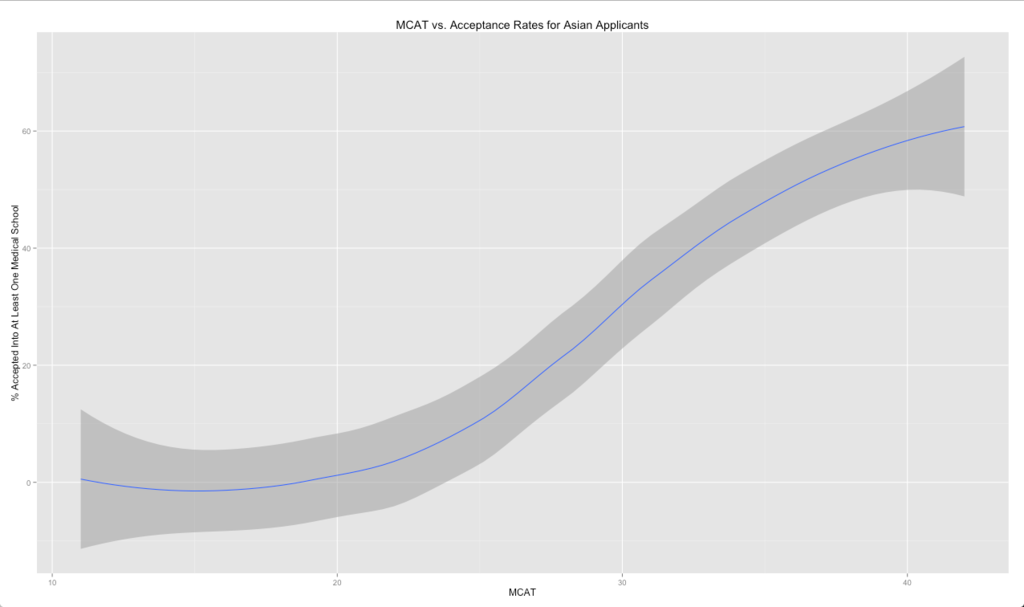
In terms of application, what does this mean? Asians need to obtain a higher minimum score than other races. Increased admissions probability starts around a score of 20, as opposed to in the teens for all other applicants (around 18 for whites, 14 for URM’s, 16 for the population lumped together).
Also, there is no flattening in the curve at the higher score echelons. Score beyond 40 has little effect of moving up the average school’s probability curve for whites, 37+ is considered the same in terms of admissions odds for URM’s, but there is no flattening effect observed for Asian applicants.
Each score increase on the MCAT improves their chances even at the average school. This is also seen in the MCAT sensitivity curve with respect to the entire applicant population.
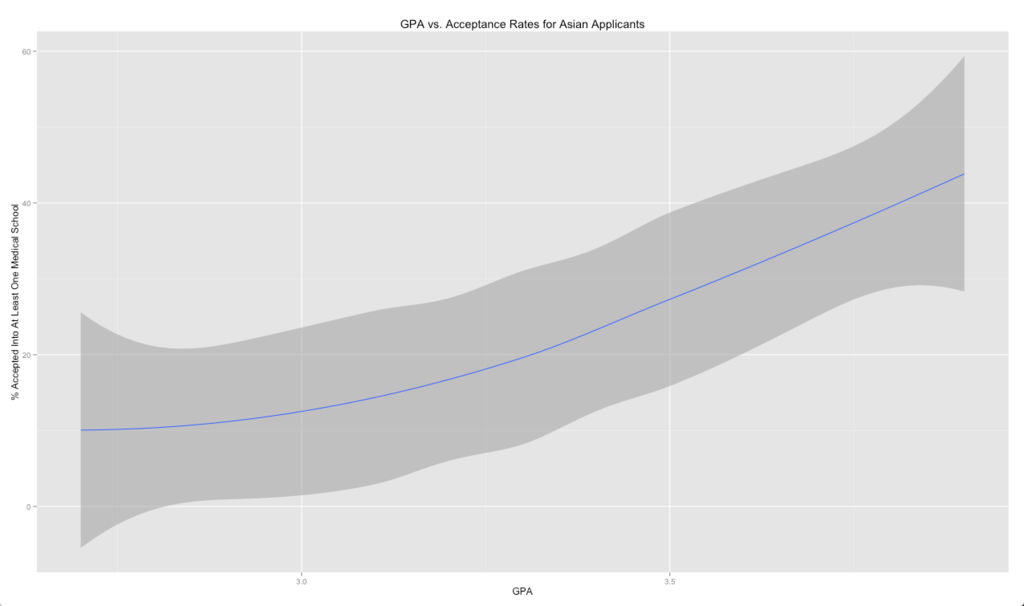
With respect to GPA, there is exponential growth up to 3.30, and linear growth from 3.30 onward. There is no diminishing growth or flattening sensitivity with respect to the GPA curve for Asian students.
Also notice how the sensitivity curves for Asian students intersect certain MCAT and GPA points lower down the acceptance rate scale.
URM Applicant Pool
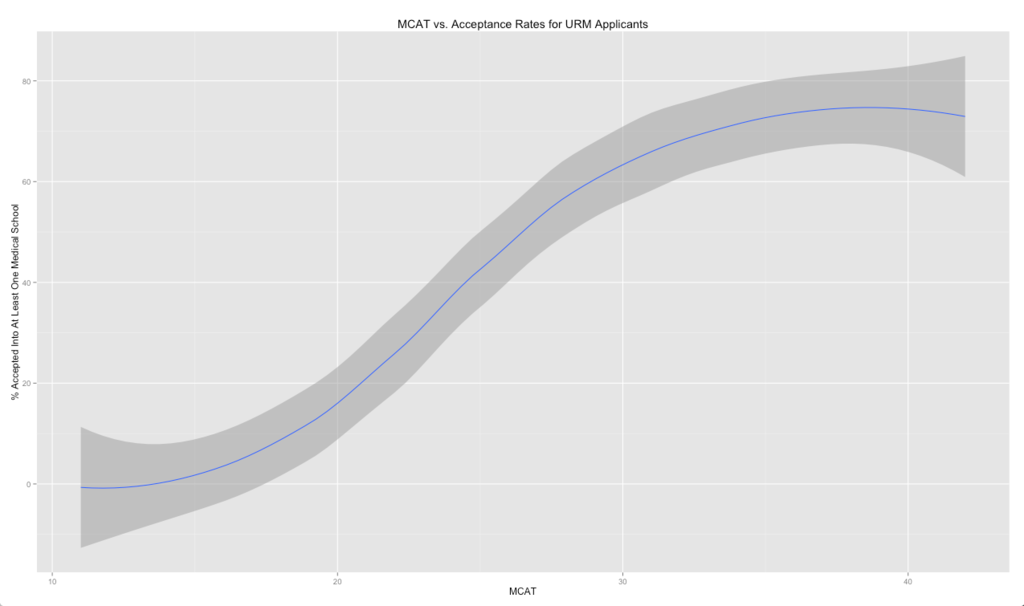
The negative growth after 39 is due to small sample size, as noted by the standard error cloud in the graph above.
This suggests that as it pertains to the URM applicant pool, a score increase beyond 36-38 will do little good in improving admissions probability at the average medical school.
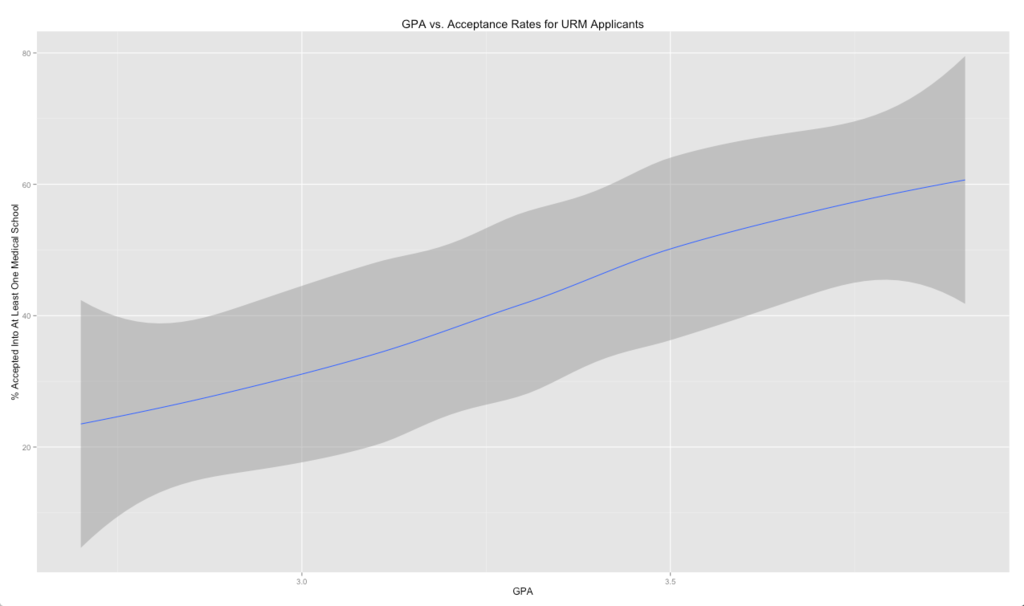
The URM GPA curve is markedly linear relative to other GPA curves. There is little exponential growth and little diminishing growth.
There is slight, but not notable, exponential growth up to 3.25, linear growth from 3.25-3.50, and slight, but not notable, diminishing growth beyond 3.65.
Notable Takeaways
1. Admissions standards are highest for Asian students, second-highest for whites, third-highest for the entire applicant pool as a whole (though close to whites), and fourth-highest for URM’s together (in an order of Hispanic/Latino, Native Americans, and Black/African American, when broken down into their components).
2. At the highest GPA and MCAT scoring tiers (i.e., which can be loosely defined as 3.60+ and 34+, respectively), an increase in GPA will hold more of an effect on acceptance chances than an increase in MCAT scores.
At the mid-tiers (i.e., 3.20-3.60 GPA and 21-33 MCAT), they will hold more equal weight. At the lower GPA and MCAT scoring tiers (i.e., <3.20 and <21, respectively), increasing one’s MCAT score will hold more of a proportional effect.
3. GPA and MCAT sensitivity curves as they relate to cumulative admissions chances can vary markedly by race/ethnicity, and also by individual school due to selectivity differences.
More selective institutions will have less or no diminished growth or flat/flattening sensitivity in their respective GPA and MCAT curves, while schools with lower admissions standards will have more conspicuous levels of diminishing growth or flat/flattening sensitivity beyond certain GPA and MCAT thresholds.
In other words, certain GPA and MCAT qualifications at low-selectivity institutions may be “good enough” to obtain admission wherein higher grades and scores have little additional influence. However, at the most selective institutions, this will not be the case and higher will nearly always be better.
4. Applying to more medical schools is always a surefire way to increase one’s cumulative probability, as it essentially equates to buying more tickets to the admissions lottery. This was discussed in a previous article concerning the number of jobs or schools one should I apply to in order to optimize one’s chances.
However, this follows a pattern of diminishing returns from the outset and highly qualified candidates are unlikely to receive any additional benefit from applying to 100 as they would applying to just 30 schools.
However, for less qualified applicants, who essentially have flatter probability curves, applying to more will be of greater advantage and have less prominent declining returns.


