Corsi and Fenwick numbers have been a large focus of the hockey analytics community over the past few years with their robust predictive effects relative to simpler stat-keeping items like goals for, save percentage, plus-minus, offensive zone faceoff percentage, and things of that nature.
Corsi and Fenwick numbers effectively work by serving as a stand-in metric for puck possession. Puck possession has become an analytics focal point in hockey by virtue of its potential implications toward team performance.
If you possess the puck for 55% of your season instead of the standard 50% average, that would be the equivalent of a team in baseball getting about ten innings per game to bat versus just eight for the other team.
With such a distinct advantage, over the course of an 82-game season it would certainly add up to more chances to score and hence win hockey games.
Table of Contents
How do Corsi and Fenwick numbers measure puck possession?
Possession in hockey isn’t as simple as measuring possession in other sports, such as soccer, football, and basketball, given that each team will not possess the puck at all during large portions of the game.
Possession is effectively neutral in many instances.
As a consequence, we need a proxy to measure this. There are two basic schools of thought on how to do this with Corsi and Fenwick numbers, by taking into account shots on goal, missed shots, and, in the case of Corsi numbers, blocked shots.
Those who lean more heavily toward Fenwick numbers don’t prize blocked shots as heavily as those within the Corsi camp who treat blocked shots the same as any other shot attempt.
Blocked shots, some will argue, are more of a neutral statistic that truly don’t have a lot of predictive value when it comes to puck possession.
Those who prefer Corsi will argue that a blocked shot really isn’t much different than a shot or missed shot being the puck still has to be controlled and directed on goal for a shot to be considered “blocked” in the first place. The definitions go as follows:
Corsi = Shot Attempts = Shots + Missed Shots + Blocked Shots
Fenwick = Shots + Missed Shots
Both metrics will understandably be close when compared team by team, as blocked shots don’t account too heavily.
For data analysis purposes, Corsi and Fenwick numbers are best transformed into a percentage. This takes your Corsi For number (total shot attempts your team took), divided by the sum of your Corsi For plus Corsi Against (total shot attempts opponents took) number.
The resultant statistic is called the Corsi For percentage, or typically abbreviated CF%. The same is done for Fenwick numbers, with Fenwick For percentage commonly articulated as FF%.
Expressed as a percentage, the average will naturally come out to 50%.
Corsi and Fenwick Shot and Save Percentage
These components are also broken down into two common additional metrics, known as CSv% (Corsi save percentage), CSh% (Corsi shot percentage), FSv% (Fenwick save percentage), and FSh% (Fenwick shot percentage).
For purposes of this analysis, we’ll look at CF%, FF%, CSv%, FSv%, CSh%, and FSh%, and their predictive capacity with respect to seasons points total. All Corsi and Fenwick data can be obtained online. Season points totals can be located at ESPN and other avenues.
These statistics will be considered for all 5-on-5 (even strength) situations. There is some debate that these statistics should only be considered in close situations, where the score is either tied or one team is ahead by no more than one goal.
This ensures that the playing incentives of both teams are roughly equal.
When the goal margin is high, teams may change tactics from conservative to aggressive or vice versa in order to close or maintain the gap. Likewise, a team on a penalty kill is primarily incentivized to play tight and defensive until they can get their skater(s) back. But controlling for game situation was considered in a different analysis.
Taking into account all even strength scenarios ensures a higher amount of data.
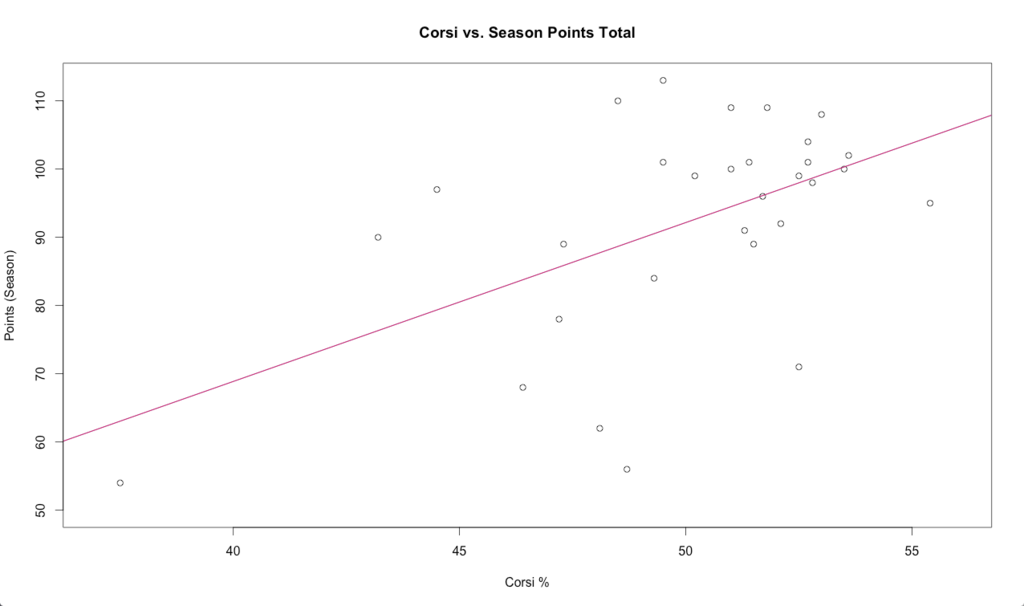
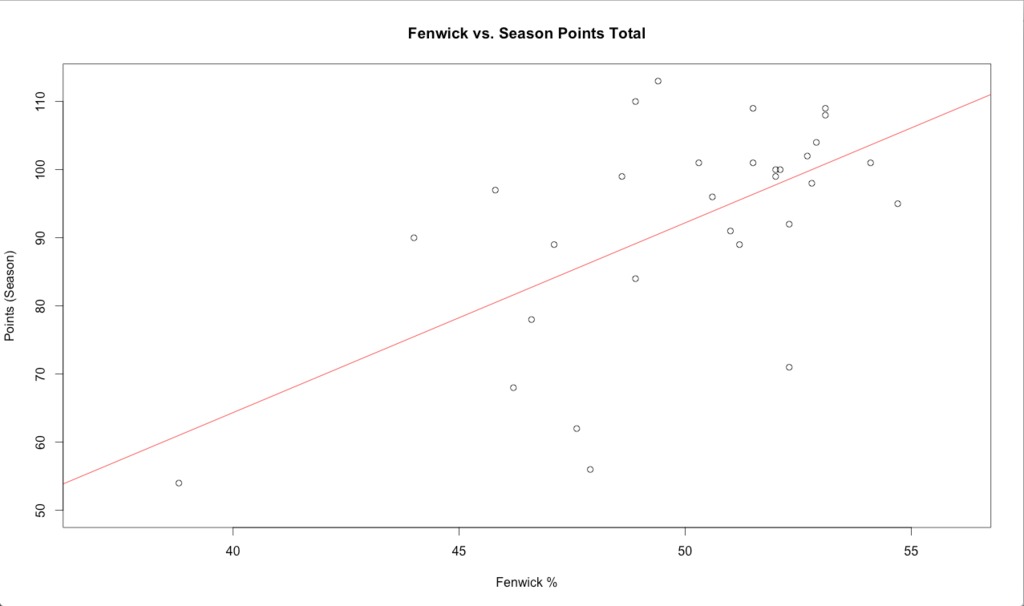
The correlation between these Corsi and Fenwick metrics with respect to season points total sits around 0.4-0.6, denoting the positive relation that one would expect.
Naturally, robust puck possession proxies would correlate to more scoring, more wins, and hence higher points totals. But the correlation is not so strong that we would necessarily have a collinearity issue that could confound regression results.
Some basic graphs can be produced to demonstrate the general relation between CF% and FF% on season points totals:
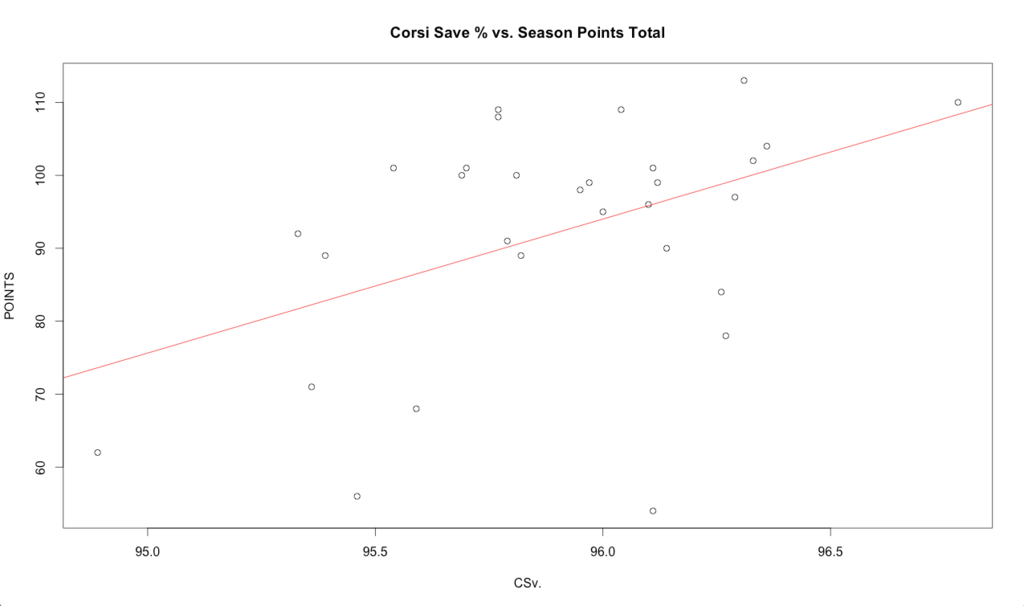
Simple linear regressions were also run on CSv%, FSv%, CSh%, and FSv% with respect to predicting season points total:
Based on simple linear regression between basic save percentage (Sv%) and seasons points totals, a 1% increase in save percentage can mean an 8-point difference over 82 games.
Eights points can mean the difference of turning a top Stanley Cup contender into an average playoff team and a fringe playoff team into one of the top four seeds in its conference.
When we look at CSv% instead of the raw save percentage stat, Sv%, it suggests even more predictive effect, with a 1% increase suggesting a potential an 18.4 points increase over 82 games. (This also held in multiple linear regression models, which we’ll get to later.)
The range is tough to predict with certainty with just basic one-variable regression, though. With a 95% confidence interval, it predicts each 1% increase in CSv% will predict anywhere from a 4.4-32.3 increase in seasons points total.
These results are also statistically significant at the 1% level.
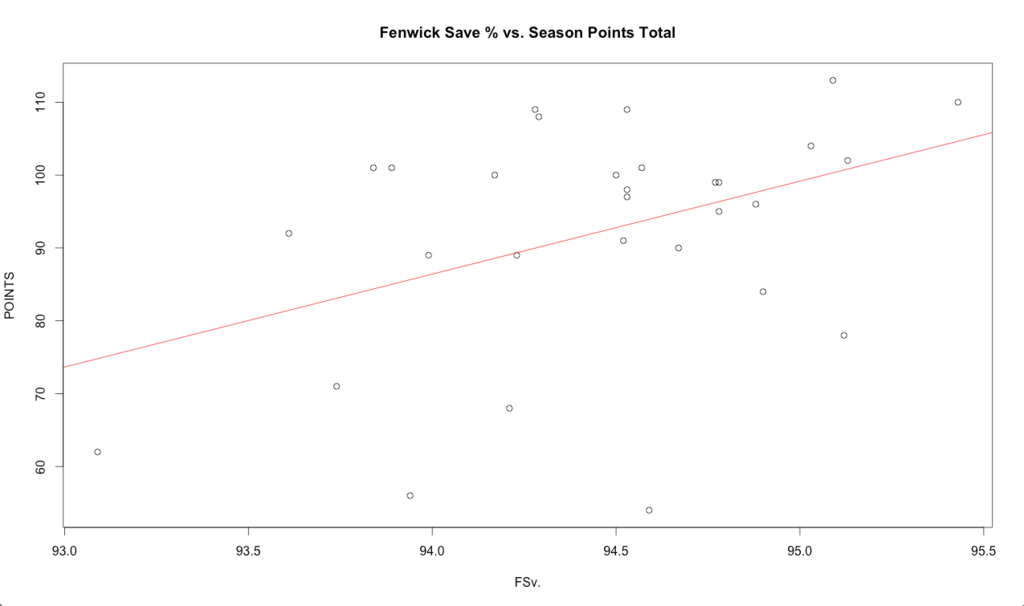
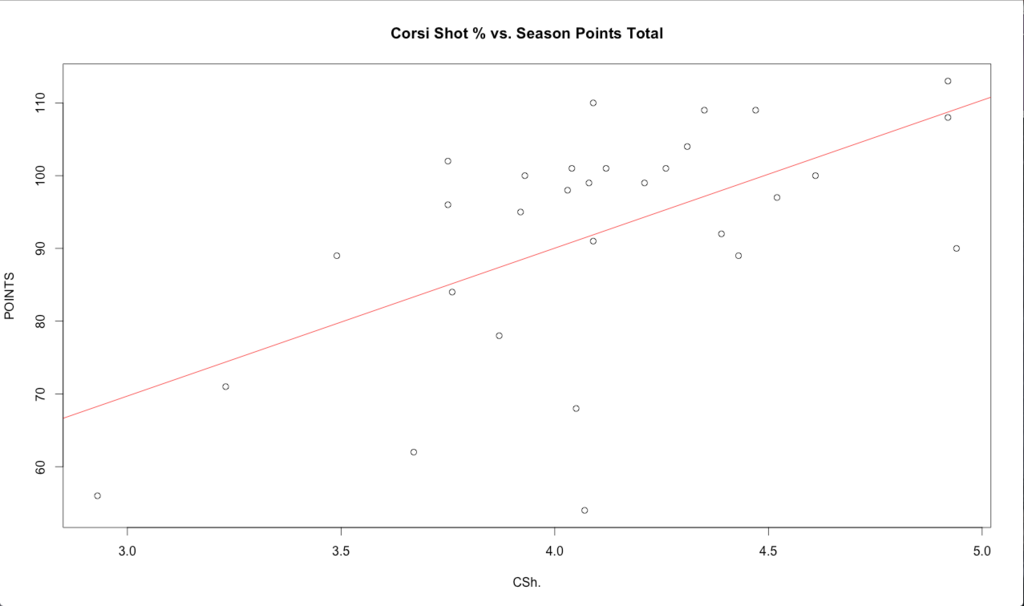
However, the results aren’t statistically significant in this case.
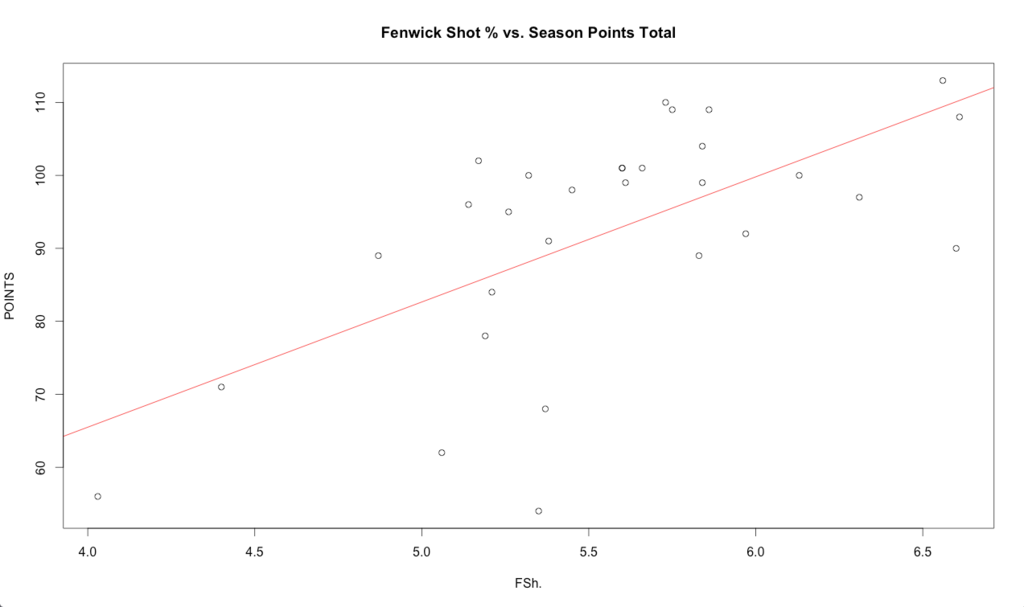
The results in this case are reported as extremely statistically significant.
Multiple Linear Regressions
In addition to the six simple linear regression models just reported, an additional twelve were performed with multiple linear regression format to better deduce the strength of each of these six considered variables in their predictive effects.
Basic statistics like tradition save percentage, offensive zone faceoff percentage (OZFO%), and defensive zone faceoff percentage (DZFO%) were also integrated into a few of these models to get a better glance at how much more effective the Corsi and Fenwick numbers were in their predictive value.
As expected, when placed into multiple regression models, the Corsi and Fenwick numbers substantively outpaced the traditional metrics in predicting season points totals and with a degree of statistical significance that wasn’t observed within the basic measures.
When standard Corsi and Fenwick percentages were integrated into a regression model that housed OZFO% and DZFO%, the latter two variables were insufficient in having notable predictive value, coming up with magnitudes that were irrational. OZFO% normally indicates greater dominance in the offensive zone and hence better team quality, but produced a negative coefficient in the regression, denoting an effect opposite of expectations.
The same phenomenon held true for DZFO%, which produced a slightly positive coefficient. Both were understandably non-statistically significant.
One traditional statistic that holds up well to an extent is traditional save percentage. When added to CF% and FF%, Sv% was still highly significant with 10.4 expected season points added.
This isn’t highly unsurprising as the league’s best goalies will normally have higher save percentages.
The quality of the defense and team in front of them matters as well, but save percentage better accounts for quality by inherently controlling for shot volume.
This makes it a better measure of quality than goals against average (GAA), for example. GAA wouldn’t be kind to goalies playing on poor puck possession teams due to the volume of shot attempts they’d be exposed to.
It would be the equivalent of a baseball pitcher having an inflated earned runs average (ERA) due to a poor defense behind him. Or a poor win-loss record due to the fact that the team around him in general is terrible.
A constant throughout each multiple regression model is that Fenwick metrics tends to have better predictive value toward point total than Corsi metrics.
In one model where six variables were used:
- Fenwick For Percentage
- Fenwick Save Percentage
- Fenwick Shot Percentage
- Corsi For Percentage
- Corsi Save Percentage, and
- Corsi Shot Percentage
…Fenwick measures had positive coefficients, predicting higher season points total, while Corsi measures had negative coefficients, predicting lower season points total.
However, when the three Corsi metrics were used in a regression of their own, they all positively predicted season points total and with a maximum level of statistical significance.
This same phenomenon was seen when taking both the Corsi and Fenwick save and shot percentage variables into account in a four-variable regression model, with Fenwick showing strong positive predictive value and Corsi demonstrating polar opposite results.
However, neither of these models were found to be statistically significant at the 5% level or lower.
When just CF% and FF% ratios were considered in a regression model, FF% demonstrated positive predictive value plus significance at the 5% level.
CF% had negative predictive value toward season points total and demonstrated no statistical significance.
The effect is particularly notable within the FSv%. An uptick of 1% of Fenwick shot percentage predicts an increase of 45 points per season and is significant at the 5% level when applied in a multiple regression framework along with CSv%.
Note that a 1% increase in Fenwick/Corsi shot or save percentage is a huge increase. The difference between the best and worst team in the league is typically only about 2.5%.
So increasing 1% in each means going from bottom in the category to nearly average, or going from average in the category to being one of the top.
In the model where all six Corsi and Fenwick variables were taken into account, an uptick of just 1% of FSv% predicts an increase of 47 points per season, although is not significant.
When Corsi and Fenwick shot percentages were integrated into the model with Corsi and Fenwick save percentages, an increase of 1% FSh% came to an increase of 40 points.
Nevertheless, it’s obviously still too simple to say that producing a 1% increase in team-wide FSh% will give you an extra 40+ points per season.
FSh% shares a strong collinearity with season points totals (above 0.6), so the regression coefficient can’t be taken precisely at face value, even though the model that regressed CSv%, FSv%, CSh%, and FSh% on season points total was found to fit a normal curve model fairly well (a prerequisite for upholding the notion that multiple regression is a robust analytical framework in the first place).
This is measured by plotting the regression’s standardized residuals against theoretical quantiles, which is a plot built-in on R software:
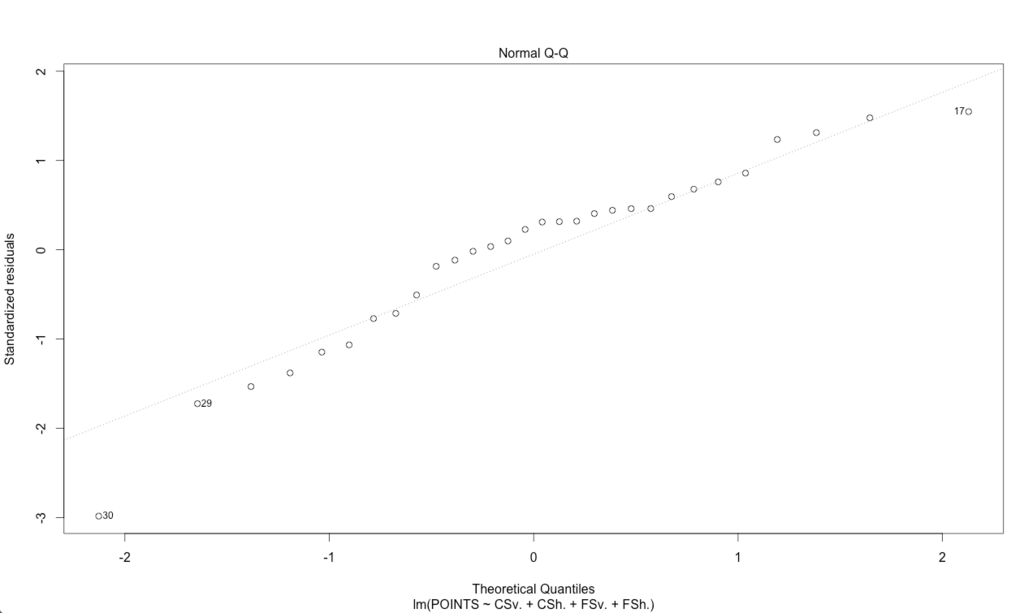
In general, multiple regression does tend to fit Corsi/Fenwick statistics well in eliciting its predictive value.
Normality holds strong in Corsi and Fenwick regressions, as the data roughly follow the straight line and holds relatively well even for notable Corsi/Fenwick-to-season points total outliers in the data, like Anaheim and Vancouver (which have weak Corsi/Fenwick data relative to their performance as playoff teams) and Los Angeles (which was a Corsi/Fenwick superstar despite not even making the playoffs).
Conclusion, Takeaways, and Implications
I found the following takeaway points from these observations:
1. Fenwick numbers tended to have slightly more predictive power with respect to these data than Corsi numbers, showing a slightly higher level of statistical significance and being more consistent from model to model.
Whether blocked shots should be integrated into a puck possession proxy is therefore something to be further debated. Based on 2014-15 season data, omitting blocked shots from the shot attempt criteria was slightly better is estimating team performance (5-on-5 for all game situations) based on the fourteen multiple regression models used in this study.
This certainly doesn’t mean that those in the Fenwick camp are the winners here; more data needs to be analyzed. Regardless, I find including both Corsi and Fenwick data into regressions to be the best way to do analysis.
2. Fenwick and Corsi numbers both have far more predictive capacity than traditional hockey statistics such as save percentage, shots-for percentage, and offensive and defensive zone faceoff percentage.
3. Boosting Fenwick and Corsi shot percentage (i.e., FSh% and CSh%) predicts a higher proportional team performance boost than increasing Fenwick and Corsi save percentage (i.e., FSv% and CSv%).
In Fenwick numbers, the magnitude of the FSh% coefficient is approximately 88% higher than the FSv% coefficient in a model that predicts seasons points total just from those two variables alone.
- A 1% increase in FSh% predicted a season’s point increase of 15.4.
- A 1% increase in FSv% predicted an 8.9-point increase over the season.
Moreover, FSh% was extremely statistically significant, while FSv% was statistically significant at the 1% level.
In Corsi numbers, the magnitude of the CSh% coefficient is about 30% higher than the Csv% coefficient.
- A 1% increase in CSh% predicted a 17.5-point increase over 82 game.
- A 1% increase in CSv% predicted a 13.2-point increase.
CSh% was significant at the 0.1% level (very high), while CSv% was statistically significant at the 1% level (high).
4. In terms of 95% confidence intervals, Fenwick statistics predict season points total increases of the following ranges based on increasing them by 1%:
- FSv%: 0-17.9
- FSh%: 0-23.3
For Corsi numbers:
- CSv%: 1.0-25.5
- CSh%: 7.0-28.0
The Corsi and Fenwick shots percentages were notably more positive, suggesting slightly strong positive predictive effect in team performance. Additionally, as noted before, it was also more statistically significant.
5. Blending Corsi and Fenwick metrics within the same model has little predictive value. Regression models that combine Corsi and Fenwick metrics have very little statistical significance.
The opposite is true with Corsi-only and Fenwick-only models, which have high statistical significance.
6. Fenwick-only models have higher R-squared values than Corsi-only models. This means that Fenwick-only models better account for the variance in the data. This is generally a good thing.
The phenomena was observed across several Fenwick-only and Corsi-only models. The difference is slight. There is also some debate among statisticians among the true value of R-squared as a measure of regression robustness.
Implications
What does this mean in terms of organizational personnel strategy?
In terms of NHL scouting, locating players with higher Fenwick and Corsi numbers among the six discussed here (FF%, FSv%, FSh%, CF%, CSv%, and CSh%) will help create a team that is skilled in puck possession.
Fenwick was slightly more illustrative at the team level. FSv% and CSv% might prove useful in terms of component stats due to the highly positive regression coefficients displayed in all statistically significant regression models.
Limitations
1. As discussed, this study only looks at 5-on-5 data over the course of the 2014-15 regular season without controlling for game situation.
2. PDO data was not included, nor the particular Corsi and Fenwick interpretations.
PDO discusses the extent to which past team performance being predictive of future performance. (It was be discussed and analyzed in a different piece.)
3. It is assumes that the value that we are predicting with our independent variables – season points total – is an efficient measure of success and particularly with respect to who will come out on top at season’s end.
The most glaring inefficiency in using season points total is that overtime and shootout games have three points up for grabs versus just two for games that complete in normal regulation.
This has certain incentives that can be exploited by teams, such as being content to play for overtime toward the end of tied games to ensure that at least one point is earned for their efforts.
4. Puck possession is not the be-all and end-all of successful hockey strategy.
Playing style is still important as well and puck possession is merely one component.
But at this point, maintaining control of the puck for the majority of the game beats out even goaltending as a more important factor in an NHL team’s success. But one can’t discount what great goaltending can do for a club.
A drop in one percentage point when it comes to save percentage – for instance, from 93% (i.e., near-elite level of goaltending) to 92% (i.e, good, but certainly not great) – costs a team an average of 8.5 points per season holding all other factors constant. In the standings, this could mean the difference between obtaining the eighth and final playoff seed, or going from the top playoff seed to an average playoff team.
But the thing with goaltending, though, and regressing it with respect to team points, is that standard linear regression assumes normality in the data (bell curve distribution).
However, if you attempt to predict points from save percentage via linear regression, and test the normality assumption against a plot of the data’s standard residuals versus theoretical quantiles (see graph below), attempting this exercise becomes more dubious.
In the center of the data, where save percentage and points total is more toward typical totals, the normality assumptions hold.
At the tail ends of the distribution, especially at the lower totals, the predictive capacity of linear regression on save percentage versus points total becomes less robust. For “normal” totals relative to the 2014-15 NHL season, save percentage varied from 91.85%-92.90% with respect to the 25th and 75th percentile. Points total varied from 89 to 101 at the 25th and 75th percentile, respectively.
Of course, exceptions always apply. Buffalo had league-average goaltending (92.41%) and was the worst team in the league during that season. New Jersey had elite-level goaltending (93.45%) and missed the playoffs that year.


